


🔑 Register an account with Gate BS
👨💼 Complete KYC within 24 hours
🎁 Claim Points Rewards
Your Gateway to crypto news and insights
The AMA Flow:
Session 1: Group will be muted to have several questions with our Guest including introduction.
Session 2: Group will be opened for community to ask their questions for 5 minutes. Speaker will select 3 questions to answer.
Session 3: 3 Lucky users with best questions will get $5 bonus of each.
Dan: Hi everyone, It's me again Dan today we have Q&A about "How to read candle stick"
Kris: Hello @Dan, I really like to know about the candle sticks, it is very technical.
Dan: Ok, let's get it started.
Kris: Thanks, here you go!
1.About What is candle stick
Q : Can you tell me what is candlestick ?
A: Candlesticks show that emotion by visually representing the size of price moves with different colors. Traders use the candlesticks to make trading decisions based on regularly occurring patterns that help forecast the short-term direction of the price.
Q : What we will see from candlestick ?
A: We will see where the priced "open" for a period, where the price "closed" for a period as well as price "highs and lows" for a period .
2.Types of candlestick
Q : How many types of candlestick ?
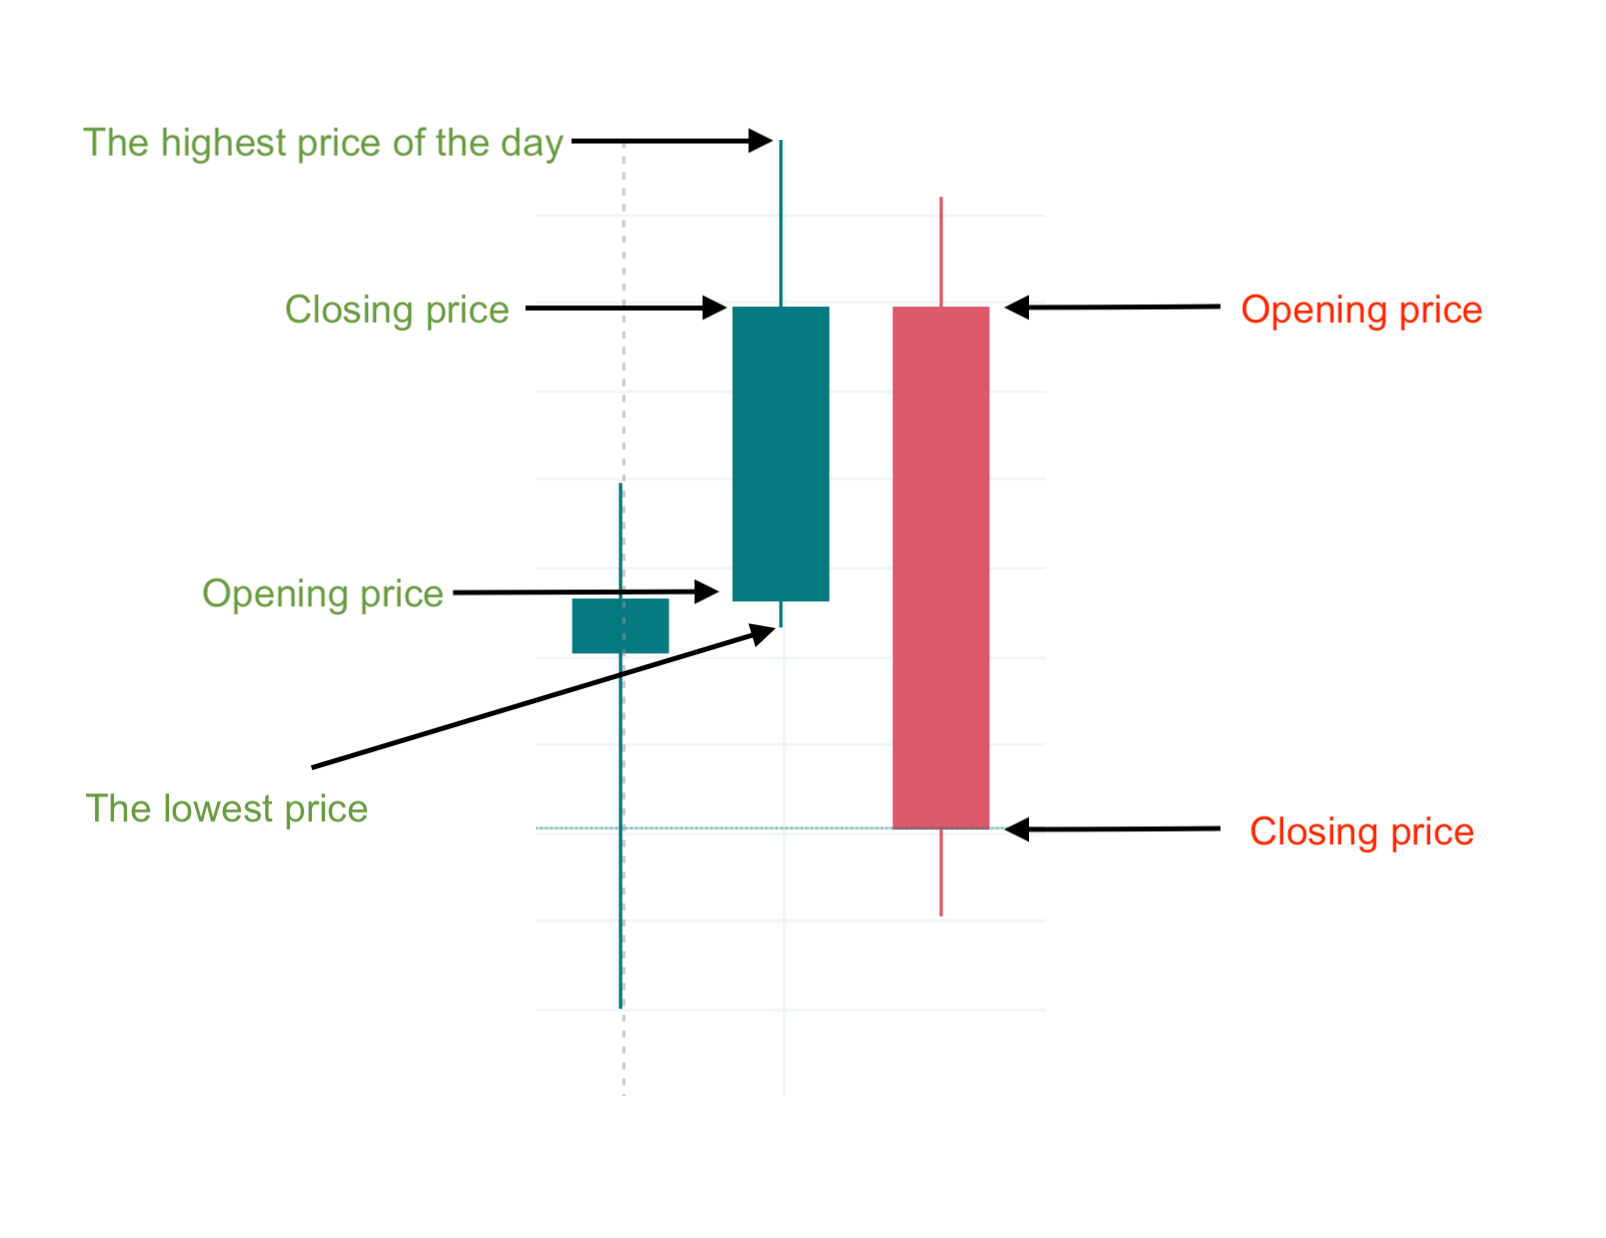
A: there are 2 typs of candlestick, Candles are either bullish or bearish depending on the direction of the price during the period they are drawn for.
A bullish candlestick forms when the price opens at a certain level and closes at a higher price. This type of candlestick represents a price increase over the period in question.
A bearish candlestick forms when the price opens at a certain level and closes at a lower price. This candlestick shows a price drop.
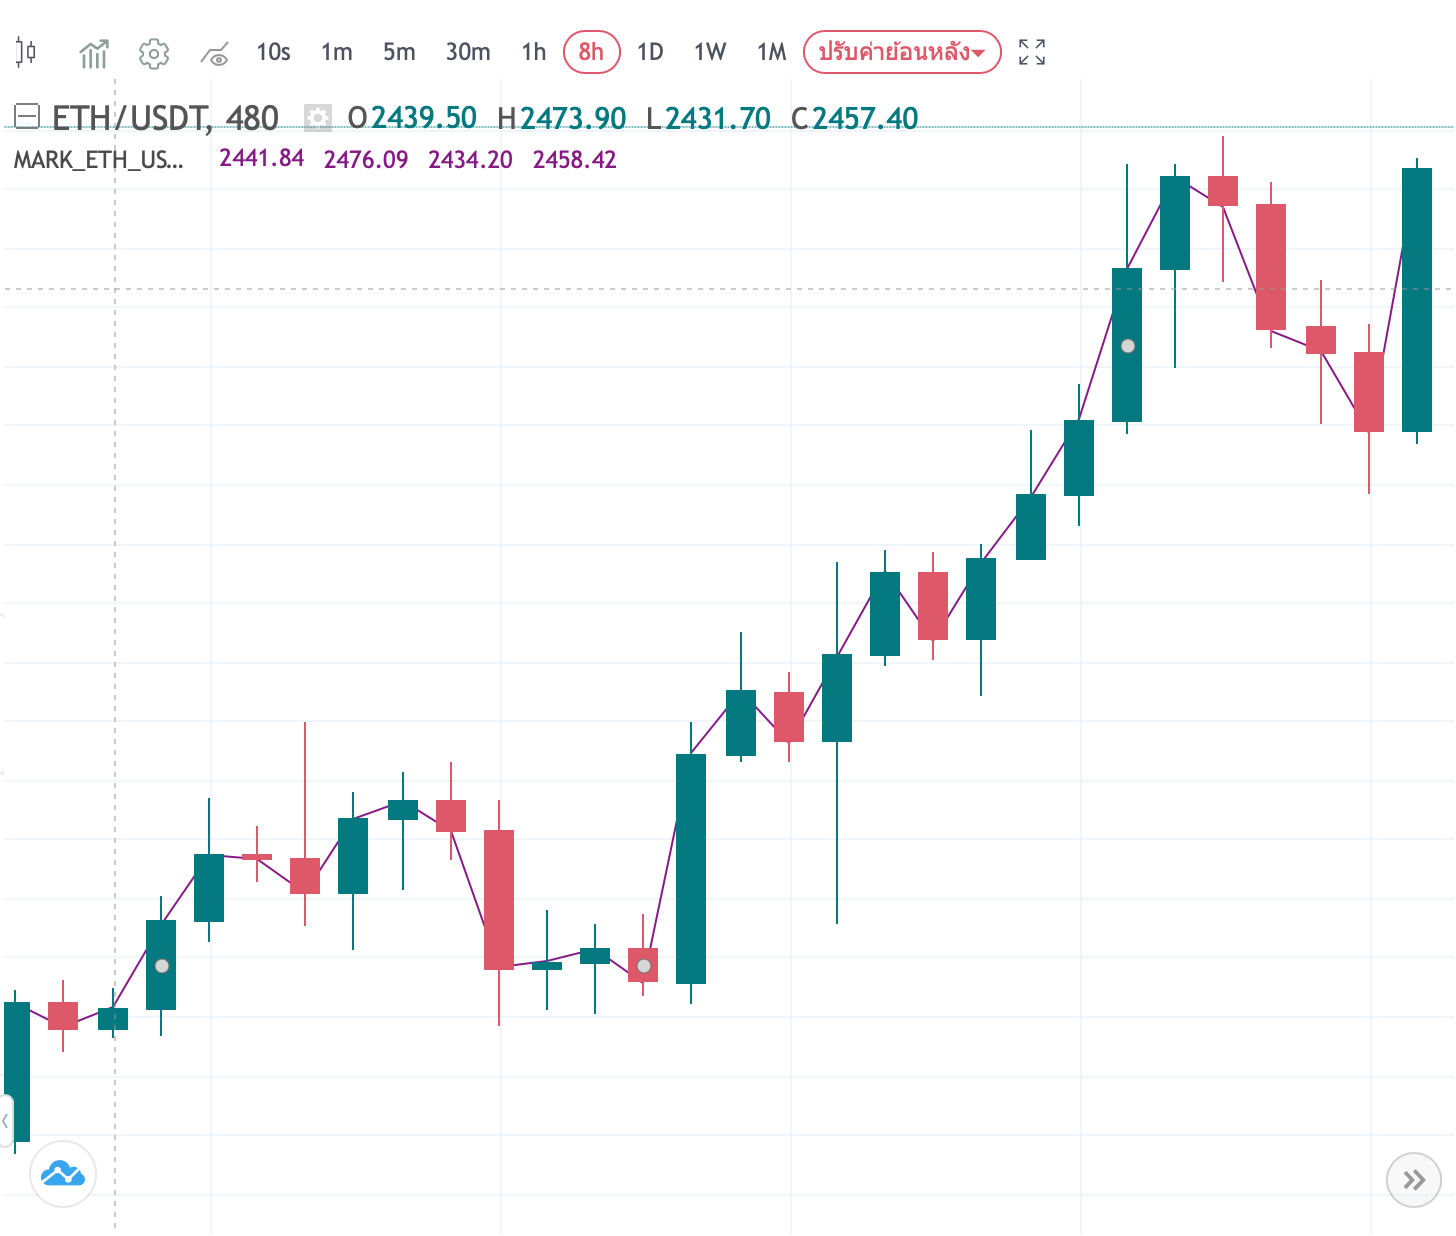
The graph you see is an 8-hours candlestick chart where each of the candlesticks represents an 8-hour period.
Q : Can we choose to look another time frame besides 8 hours ?
A : Yes you can, You can use many different chart time frames or periods to plot candlestick charts in your technical analysis system, we provide 10s, 1m, 5m, 30m, 1g, 8h, 1D, 1W, 1M
Example : Here is the time frame for 1M
3.How to read candlestick
Q: Oh i got it, Can you show me how to read the candlestick now ?
A : Yes, of course, so let's start, I give you short cut to understand here s picture !
Q : Let's have a test
Q : From the picture you can see the price on 2021-08-24 7AM is open at 3323.60 and closes at 3345.00., Can you tell me if "open lower and close at higher" is bull or bear ?
A: It is bullish right ?
Q: Yes correct !
Q : Up next. The next candle 0n 2021-08-24 3PM if open at 3345.00 and closes at 3217.40. You think this chart is bull or bear ?
A : It is is bear because it has "opened high and closes low".
Q : Yes ! So now you know how to read the candlestick.
🔑 Register an account with Gate BS
👨💼 Complete KYC within 24 hours
🎁 Claim Points Rewards
